
In photos: Cape Town’s flooded townships
The amount of rain in Cape Town over the past few weeks is dramatically captured by the graph below published by the municipality, which shows the volume of the city’s major dams every week since 2018. Note what has happened in the last three weeks as represented by the dotted navy blue line. While rain […]

The amount of rain in Cape Town over the past few weeks is dramatically captured by the graph below published by the municipality, which shows the volume of the city’s major dams every week since 2018. Note what has happened in the last three weeks as represented by the dotted navy blue line.
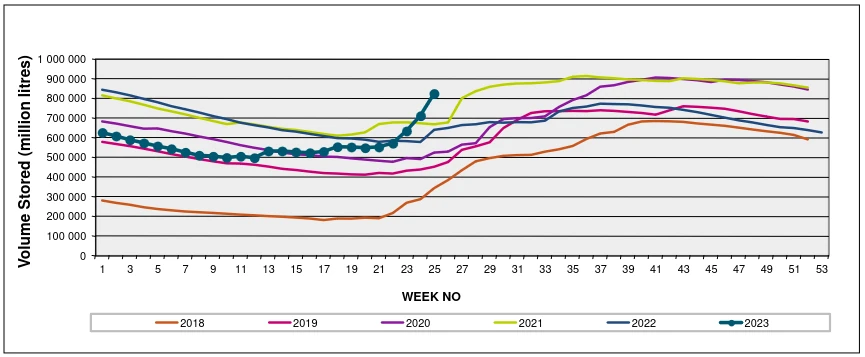
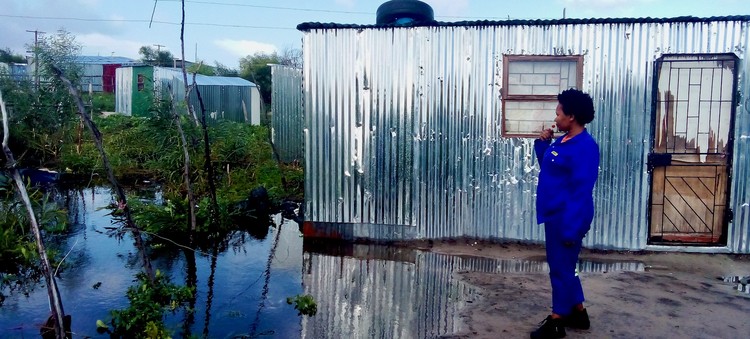
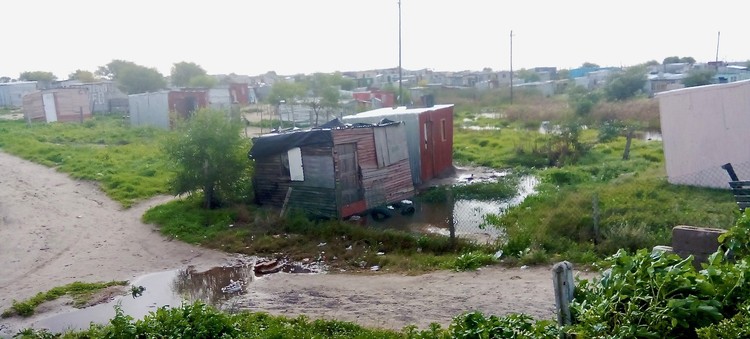
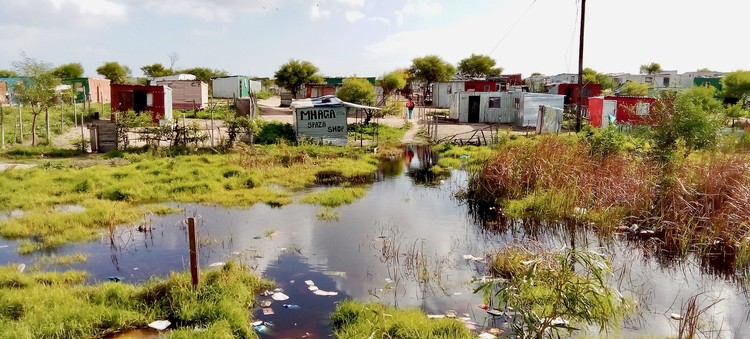
While rain is a relief for the drought-prone city, the deluge has caused much of the Cape Flats to become a wetland, flooding homes, and causing misery for many. Adding to this, the South African Weather Service issued a warning that the city will receive damaging winds on Monday.
The following table, also from the municipality, shows that rainfall recorded at all but one of the city’s dams (Steenbras being the exception) far exceeds the June average and the month is not yet over:


Published originally on GroundUp | By Chris Gilili and Vincent Lali
