Covid-19 Has Claimed Nearly Quarter Million Lives in South Africa, According to MRC Research
Over 260,000 more people have died in South Africa since May 2020 than expected. This is according to researchers at the Medical Research Council (MRC), who estimate that 85 to 95% of these “excess” deaths are directly from Covid. This is nearly three times as high as the official Covid death toll published by the […]

Over 260,000 more people have died in South Africa since May 2020 than expected. This is according to researchers at the Medical Research Council (MRC), who estimate that 85 to 95% of these “excess” deaths are directly from Covid.
This is nearly three times as high as the official Covid death toll published by the Minister of Health. The problem with the official death toll is that it only includes confirmed Covid deaths in health facilities. People who die at home, in an institution like an old-age home, or before getting a Covid diagnosis, are left out of the official count.
There is now enough data to reach some interesting conclusions about how the pandemic has affected mortality.
How the death rate has changed over the past two decades
The number of deaths in South Africa steeply rose in the late 1990s, peaking in 2004 to 2006 at about 650,000 per year. Life expectancy dropped dramatically, to about 54.
This was due to the AIDS epidemic. South Africa had (and still has) more people living with HIV than any other country in the world.
Antiretroviral medicines helped fix this dire situation. Millions of South Africans with HIV take these medicines daily and it helps them to live healthy lives with almost normal life expectancy. From 2007 to 2019 annual deaths declined and life expectancy steadily rose to about 65.
Then Covid hit.
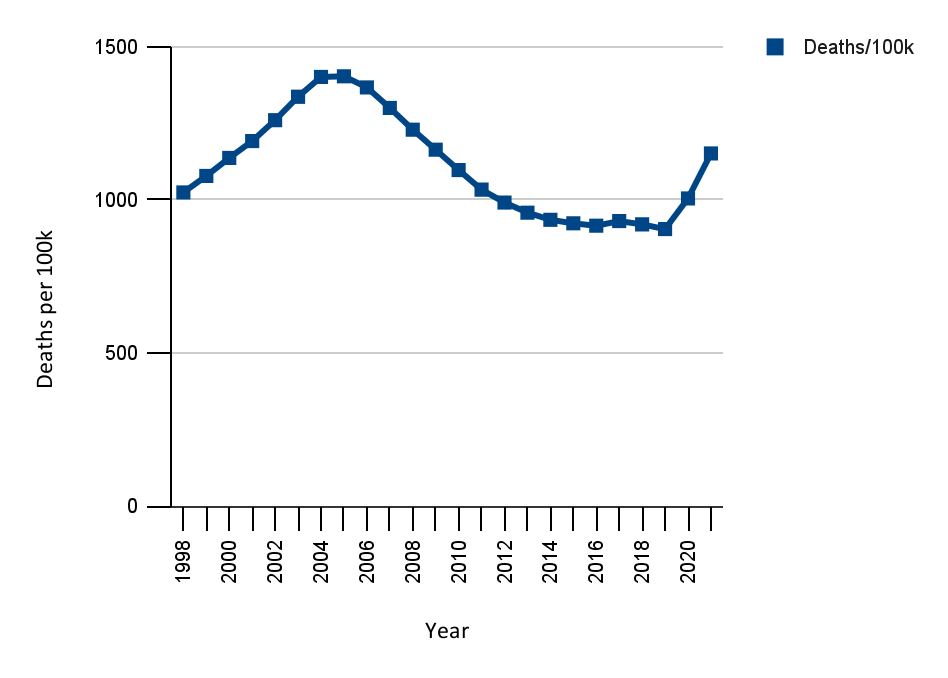
In 2020 and 2021 the number of deaths has risen dramatically. People like to think of mortality in terms of life expectancy, but this raises more complications than we can get into here. One simple way to report trends in deaths data in a way that is balanced over long times, and comparable between countries of different sizes, is to indicate the number of deaths per year, per 100 thousand population. This is shown, from 1998 to 2021, in the graph below.

This graph shows how deaths per 100,000 people in South Africa rose to a peak in the mid-2000s because of AIDS, then dropped following the scale-up of the antiretroviral treatment programme. Then deaths went up again with the arrival of Covid in 2020. To construct this graph we used population estimates from the Thembisa model, mortality estimates from 1998 to 2016 from the Thembisa model, and recently released mortality data from 2017 to 2021 from the MRC. The mortality data for 2021 only goes up to week 39 of the year. We have conservatively estimated that about 10,000 people will die weekly for the rest of the year – which assumes that there won’t be significant mortality from a fourth Covid wave this year. We have not aimed for pinpoint accuracy, and others might reasonably make different assumptions and choose different data sources, but no reasonable method will lead to a significantly different picture.
There are important differences between the way the HIV and Covid epidemics have affected South Africa.
AIDS has killed many, many more South Africans over a much longer period of time. In the mid-2000s it probably killed more people in this country annually than Covid is going to kill in 2021. It also killed much younger people on average than Covid: 75% of Covid deaths in the country are among people over 60, while most people who died of AIDS in the 2000s were in their 20s to 40s.
AIDS still kills about 70,000 people in South Africa a year (about a quarter of its mid-2000s peak). On top of this, there’s tuberculosis. Because of the combined effect of these three epidemics, nearly as many people will die this year as in 2005 or 2006, the years with the most recorded South African deaths. (Note though that the population has grown from about 47 million in the mid-2000s to nearly 60 million now.)
The AIDS deaths are spread more or less uniformly over a year. But Covid comes in surges. Measured over the worst three to six week periods (January 2021 and July 2021) the rate of Covid deaths has far exceeded AIDS deaths over any equivalent period of time. Also, many more people contract Covid than HIV, and most people with Covid who end up in hospital survive, which was not the case for people with AIDS before antiretrovirals became widely available. What this means is that for short bursts Covid has overwhelmed the health system far more than HIV ever did.
Also, what the death data don’t capture are the potentially millions of people with long Covid symptoms.
Misinformation about the deaths
A South African misinformation “news” site recently claimed: “Excess deaths are calculated off a government prediction of how many people government employees expect to die.”
This is misleading, to say the least.
The vast majority of the deaths reported by the MRC are based on actual death notifications captured by Home Affairs. Only about 15% of the MRC’s death count is an estimate — an estimate of the number of people whose deaths went unrecorded because they were undocumented, or no death notification for them was (or has yet been) processed — and the methodology underlying this estimation was developed over time, well before Covid struck.
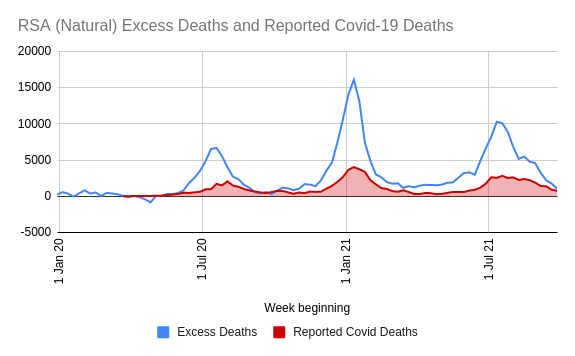
Another misleading claim on the same site is: “No one knows how many excess deaths are directly due to COVID.” Well, nothing is known with absolute precision, but we do know, with confidence, that most of the excess deaths are SARS-CoV-2 infections. How? There are several lines of evidence, but the most compelling is simply timing. Take a look at this graph produced by the MRC:

This shows the natural excess deaths, along with the official Covid deaths. Note how the excess deaths increase and decrease almost perfectly in step with the official Covid deaths. The alignment is clear across all three Covid waves. Unless one imagines some other perfectly timed source of deaths that is not Covid but exceeds Covid in scale, the only reasonable explanation for this is that Covid is causing most of the excess deaths. Hardship from lockdown produces long term stresses rather than waves of death. The strain on the healthcare system during Covid surges may also cause non-Covid excess deaths, though this is small in comparison to deaths directly due to SARS-CoV-2 infection.
With time, more and better data may emerge. For example, eventually, the cause of death data on the death certificates will be processed. But the story we’ve described here is clear already.
