Report Reveals Alarming Pollution Along Cape Town’s Coast
Several of the beaches most loved by Capetonians for surfing, swimming and sunset picnics are polluted enough to fail the minimum water quality guidelines over the last two years, according to a report released by the City of Cape Town. Muizenberg, Fish Hoek, Monwabisi and Beta Beach are among 31 polluted sites along Cape Town’s […]

Several of the beaches most loved by Capetonians for surfing, swimming and sunset picnics are polluted enough to fail the minimum water quality guidelines over the last two years, according to a report released by the City of Cape Town.

Muizenberg, Fish Hoek, Monwabisi and Beta Beach are among 31 polluted sites along Cape Town’s 307km of coastline, as revealed by the long-awaited coastal water quality report released by the City on 20 March.
The report, titled Know Your Coast, reveals annual results from 2015 to 2019 at 90 testing sites where the City collects samples every two weeks. This is the first report available to the public on coastal water quality since 2013, when the City stopped presenting the water quality results to subcouncils.
The 2018 State of the Environment Report only contained aggregated data from all the sites, and only up to 2016.
Over a third of the sampling sites recorded “poor” water quality during 2019, with 11 of them being chronically polluted, having been recorded as poor every year since 2015. Nine other sites failed the minimum standards in four of the five years, including 2019. Beaches on both the Atlantic coast and in False Bay are affected.
The City of Cape Town scientific services test the samples for the presence of intestinal enterococci and E.coli bacteria. These organisms, particularly enterococci, which survive longer in salt water, indicate the presence of other pathogens. Exposure to high levels of these bacteria and other pathogens causes gastrointestinal illness and upper respiratory infections.
False Bay
Almost half (45%) of the 49 testing sites in False Bay failed the minimum water quality guidelines in 2019.
The water quality at almost every site from Muizenberg to Strandfontein and from Monwabisi to Gordon’s Bay is rated “poor”. Most of these sites suffer from chronic pollution, failing the minimum guidelines every year since 2015.
The bay receives wastewater discharge from the Cape Flats waste water treatment plant at Strandfontein, the Zandvliet plant in Macassar, and the Gordon’s Bay treatment plant, as well as heavily polluted stormwater from Cape Flats settlements lacking access to water and toilets.
The presence of pharmaceutical compounds and industrial chemicals found in fish brought in to Kalk Bay harbour has been linked to chronic pollution in the bay.
The predominantly clockwise water circulation leads to pollutants being deposited in the middle of the bay and in the north-eastern corner, at Gordon’s Bay, as well as in sheltered places such as Simon’s Town, Fish Hoek and Muizenberg.
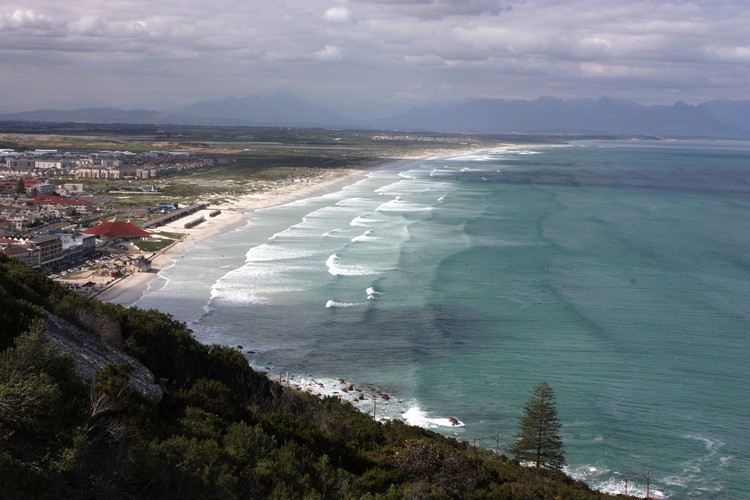
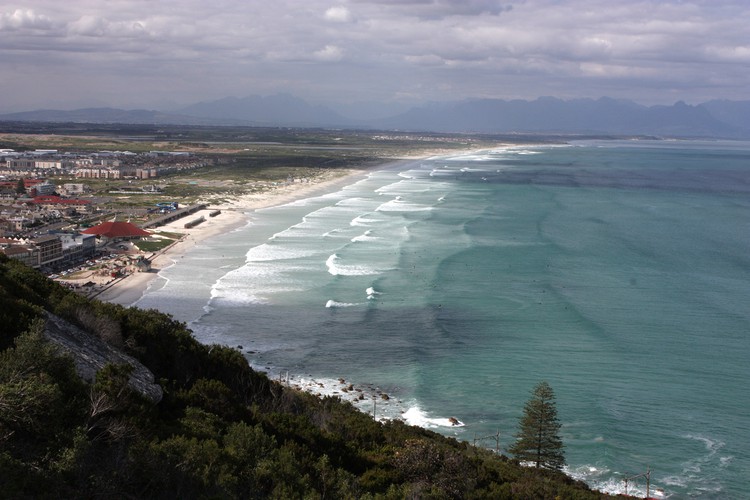
The 22 False Bay sites rated “poor” include Muizenberg station, where hundreds of surfers paddle out almost every day, and Fish Hoek, which is a popular family beach due to its calm waters.
Due to polluted stormwater flowing into the swimming zone from the Fish Hoek central business district, Fish Hoek has been rated “poor” every year except for 2018, when it was rated “excellent”.

Atlantic coast
The data shows Beta Beach in Bakoven has short-lived pollution spikes due to contaminated stormwater flushed to the ocean following rain – it was at its worst in September 2019. Clifton achieved excellent ratings in 2018 and 2019. But three sites on the Atlantic coast have been rated poor for five consecutive years: Lagoon Beach in Milnerton, Saunders Rocks in Seapoint, and The Kom in Kommetjie.
All three of these are situated at a sewage pump station or, in the case with Lagoon Beach, receive effluent from a sewage plant, which suggest infrastructure failures on the City’s part.
Camps Bay has only achieved a “fair” rating for five years running, and is the site of a controversial marine outfall releasing about three million litres of sewage per day 1.4km off the beach at a depth of 23 metres. This sewage is untreated except for being pumped through a mesh to collect solids.
Three Anchor Bay is rated “poor” every year except in 2016, when it was rated “fair”. The pollution here is caused by fats and oils illegally poured down the stormwater system, which terminates at the bay. The report notes that an attempt to install an ultraviolet light disinfectant system in the stormwater pipes “failed within a few hours, as the high fat and oil content smothered the systems”.
It goes on to state it is “unlikely that poor water quality at Three Anchor Bay is the result of the Green Point marine outfall” which pushes about 30 million litres of sieved sewage into the ocean every day.
The report does not deal with the cause of pollution at Saunders Rocks, which lies on a promontory almost exactly between the Greenpoint and Camps Bay marine outfalls. Reasons for chronic pollution at The Kom are also not provided, although the report notes it is the site of a sewage pump station.
The City, via Water and Waste Mayco Member Xanthea Limberg, has consistently denied that these sewage outfalls pose a risk to human health or the environment, although some scientists disagree.
The report does note that the “discrete spikes in bacteria counts” at Simonstown’s Long Beach, which has also failed water quality guidelines for five years running and is the site of a sewage pump station, are “are almost certainly linked to sewer pump station failure and overflow, and, possibly, effluent from the wastewater treatment works discharging under certain ocean conditions”. This may serve as an explanation for pollution at The Kom.
It is known that Lagoon Beach is polluted due to effluent from the Potsdam sewage works discharged into the Diep River and flowing out at the mouth of the Milnerton Lagoon, as well as from polluted stormwater from surrounding industrial areas and informal settlements flowing into the Diep River.
In February this year the Western Cape Government ordered the City to present plans to deal with the unacceptable levels of pollution.
City promises greater transparency
Among a raft of commitments to improve water quality, including management of the inland catchments and investigation of illegal discharge into stormwater systems, the City has promised to publish the coastal water quality report every year and to “facilitate public access to information” by updating results every two weeks on a new online site.
The City has also promised to put up signs where water quality is often poor.
Dr Kevin Winter at UCT’s Future Water Institute welcomed the City’s commitment to addressing water quality, and said the report was “a good start”. But “Beaches at Risk!” would be a more apt title than Know Your Coast, he said.
Winter said though an overview of water quality was useful, it was “not nearly enough”. Information from regular monitoring needed to be made available on a website in addition to an annual report, but certain indicators of water pollution could be measured almost in real time through the installation of sensors at testing sites.
He said the City should continually update water quality data for the public in the same way they provide information on muncipal water demand and dam levels.
He said the lag in sewage and stormwater infrastructure investments over the last ten years or more is one of the reasons for the rise in concern in contamination of our coastlines and “hopefully reports like these will improve the urgency to invest in upgrades and stir the commitment of the City Council and Mayco to see water quality as a vital component in the dealing with the health of the city”.
Measuring water quality
Enterococci and E.coli bacteria are measured in colony forming units (cfu) per 100ml. Percentiles of these counts are used to rate the water quality as excellent, good, fair, or poor.
The 24 results collected over the year are arranged from lowest to highest. This means the result from number 23 (second highest) will be the 95th percentile, and result from number 22 (third highest) will be the 90th percentile.
The national guidelines for recreational use, such as bathing, swimming, and surfing, are:
- Excellent: less than 100cfu enteroccoci per 100ml at the 95th percentile and less than 250 E.coli per 100ml at the 95th percentile
- Good: less than 200cfu enteroccoci per 100ml and less than 500cfu E.coli at the 95th percentile
- Fair: less than 185cfu enteroccoci per 100ml at the 90th percentile and less than 500cfu E.coli per 100ml at the 90th percentile.
- Poor: More than 185cfu per 100ml for enteroccoci and more than 500 cfu per 100ml for E.coli, at the 90th percentile.
Published originally on GroundUp / © 2020 GroundUp.
